PerfView — .NET Performance Analysis
Profile CPU usage, track memory leaks, and diagnose bottlenecks in .NET applications. A single portable executable built by the team behind the CLR runtime.
What Is PerfView?
A free, portable .NET performance profiler from Microsoft that runs as a single executable with zero installation.
Built by the team behind .NET itself
PerfView is a performance-analysis tool for Windows, created and maintained by Microsoft’s CLR runtime team. The primary author, Vance Morrison, spent years as a .NET Framework performance architect before open-sourcing the tool under the MIT license. That background matters: PerfView has deep hooks into the runtime internals that third-party profilers simply cannot replicate.
The tool collects CPU sampling data, GC (garbage collection) heap snapshots, memory allocation stacks, blocked-time traces, and raw ETW (Event Tracing for Windows) events. It works with both .NET Framework and .NET Core / .NET 5+ applications through EventPipe support. You get a single PerfView.exe file around 12 MB, drop it on any Windows machine, and start profiling immediately. No installer, no dependencies beyond .NET Framework 4.7.2.
Who actually uses it
PerfView has a loyal following among .NET developers who need to diagnose production performance issues without installing heavyweight IDE plugins. ASP.NET Core engineers use it to trace slow API endpoints. Library authors profile allocation-heavy code paths. The .NET team at Microsoft itself uses PerfView to benchmark runtime changes before each release. If your application runs on the CLR and something is slow or leaking memory, this is usually the first tool experienced developers reach for.
How it compares
Unlike JetBrains dotTrace or the Visual Studio profiler, PerfView is completely free and does not require an IDE. It trades polish for depth: the Windows Forms UI is functional rather than pretty, but the analysis engine handles traces with millions of samples. The stack viewer with Exc% and Inc% columns, combined with flame graph visualization and trace differencing, gives you data that paid tools often lack. The community on GitHub remains active, with regular releases addressing new .NET runtime versions.
PerfView v3.1.30 runs on Windows Vista through Windows 11 and Windows Server. Download the single portable executable from our download section and start profiling in under a minute.
System Requirements
PerfView is lightweight by design. It ships as a single 12 MB executable with no installer, so the hardware bar is low.
| Component | Minimum | Recommended |
|---|---|---|
| Operating System | Windows Vista SP2 or later | Windows 10 version 1903+ or Windows 11 |
| Processor | x86 or x64, 1 GHz+ | Multi-core x64, 2 GHz+ (faster trace parsing) |
| RAM | 2 GB | 8 GB+ (large traces can consume several GB) |
| Disk Space | ~12 MB for PerfView.exe | 5 GB+ free (trace files grow quickly under load) |
| .NET Runtime | .NET Framework 4.7.2 | .NET Framework 4.8 (ships with Windows 10/11) |
| Display | 1024 x 768 | 1920 x 1080 (stack viewer tables benefit from width) |
| Permissions | Standard user (for trace viewing) | Administrator (required for ETW collection) |
PerfView can also open Linux trace data (collected via dotnet-trace or perfcollect) on a Windows machine for cross-platform analysis.
Key Features
PerfView packs deep .NET runtime analysis into a single 12 MB executable. Here is what it can do for your applications.
CPU Sampling Profiler
PerfView captures CPU call stacks at configurable intervals and builds a complete call tree with Exclusive and Inclusive percentages for every method. The Stack Viewer lets you sort by hottest methods, fold noise, and group frames by namespace or module. This makes it straightforward to pinpoint which function is burning the most cycles in production workloads.
GC Heap Dump Analysis
Take snapshots of the managed heap and inspect every live object by type, size, and retention path. PerfView shows which objects survive garbage collection and why they stay pinned in memory.
Memory Leak Detection
Compare two heap snapshots taken at different times to find objects that keep growing. Allocation stacks trace each leak back to the exact line of code that created the problematic objects.
Wall-Clock / Blocked Time
CPU profiling misses time spent waiting on I/O, locks, or network calls. PerfView’s wall-clock analysis records blocked-time stacks so you can see where your threads spend time sleeping rather than running.
ETW Event Collection & Parsing
Event Tracing for Windows captures kernel and user-mode events with minimal overhead. PerfView collects ETW data from any registered provider, decodes it, and displays events in a searchable table. You can correlate disk I/O, network activity, registry access, and custom application events within a single trace file.
EventPipe for .NET Core
Analyze .NET Core and .NET 5+ applications through EventPipe traces collected on Linux or Windows. PerfView opens .nettrace files and applies the same Stack Viewer analysis used for ETW data.
Flame Graph Visualization
View call stacks as layered flame graphs where wider bars indicate higher cost. This visual format surfaces hot paths faster than scrolling through tabular data, especially in traces with thousands of unique call stacks.
Trace Differencing
Load two traces side by side and PerfView computes the delta. Before-and-after comparisons quantify whether a code change actually improved performance or introduced a regression.
Pattern Folding & Grouping
Large traces can contain millions of samples across hundreds of methods. Folding patterns collapse noise by grouping framework internals, leaving your application code front and center in the analysis view.
Single-File, Zero-Install
PerfView ships as one standalone .exe with no installer, no dependencies, and no registry changes. Drop it on a production server, collect a trace, and delete it when done. No installation approval needed.
Built by the Microsoft .NET Performance Team — the same engineers who optimize the CLR runtime itself.
Download PerfView and start profiling in minutes.
Download PerfView
Grab the latest release directly from Microsoft’s GitHub repository. PerfView ships as a single portable EXE – no installer, no setup wizard, no dependencies to manage.
PerfView.exe · ~12 MB · Direct from GitHub
Alternative Downloads
PerfView.exe (via aka.ms)
Microsoft redirect · Always points to latest release
GitHub Releases Page
All versions · Changelogs · Source archives
Microsoft.Diagnostics.Tracing.TraceEvent
NuGet package · For programmatic ETW analysis in your own .NET code
PerfView is portable software. Just download the EXE and run it – there is nothing to install. You will need administrator privileges for full ETW trace collection. Runs on Windows Vista through Windows 11, and requires .NET Framework 4.7.2 or later. Unlike commercial profilers such as dotTrace or dotMemory, PerfView is completely free for any use.
PerfView in Action
Real screenshots from PerfView showing CPU profiling, flame graph analysis, call tree inspection, and the main interface window.

Screenshots captured from PerfView v3.x running on Windows. Click any image to enlarge.
Getting Started with PerfView
From download to your first CPU trace in under five minutes. PerfView requires zero installation and runs as a single portable executable.
Downloading PerfView
Grab the latest release from our download section above. PerfView ships as a single standalone .exe file — roughly 12 MB. There is no installer and no setup wizard. The only prerequisite is .NET Framework 4.7.2, which comes preinstalled on Windows 10 and 11.
The download gives you PerfView.exe directly. That one file contains the ETW collection engine, stack viewer, GC analyzer, and built-in help system. You can place it anywhere — your Desktop, a tools folder, even a USB drive. It runs from wherever you put it.
If you need to profile on a locked-down production server where you cannot install software, PerfView is a good fit. Copy the EXE over, run your trace, copy the resulting .etl.zip file back to your workstation for analysis, then delete PerfView from the server. No traces left behind.
aka.ms/perfview always points to the latest stable release on GitHub. You can also browse older versions on the GitHub Releases page if you need a specific build.
Running PerfView for the First Time
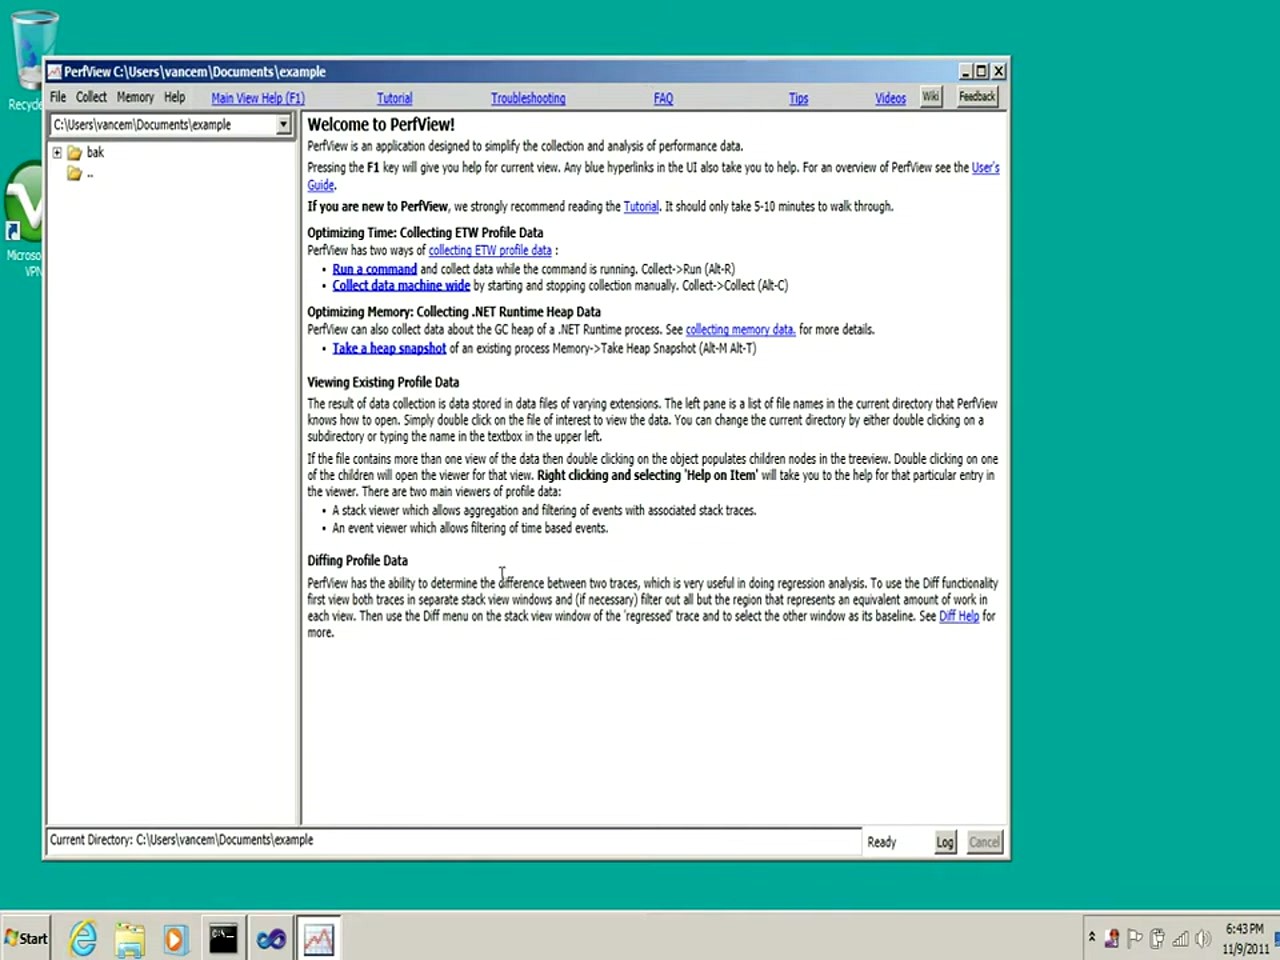
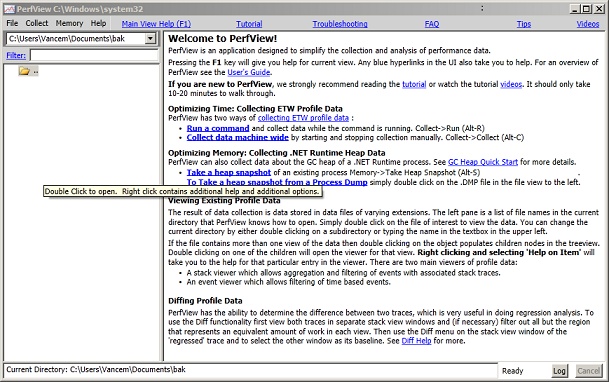
Double-click PerfView.exe and the main window opens immediately. No registration or license key required. You will see the Welcome to PerfView home screen, which works like a simple web page with clickable blue hyperlinks.
The left pane shows a file/folder tree of your current directory — this is where PerfView looks for .etl trace files. The right pane displays the welcome text, which doubles as a quick-start reference. At the top you will find the menu bar: File, Collect, Memory, Help, and the navigation links for Tutorial, Troubleshooting, FAQ, Tips, and Videos.
For full ETW tracing capabilities (CPU sampling, kernel events, system-wide collection), you need to run PerfView as Administrator. Right-click the EXE and select Run as administrator, or launch it from an elevated command prompt. Without admin rights, PerfView can still analyze existing trace files but cannot collect new system-wide data.
Collecting Your First CPU Trace
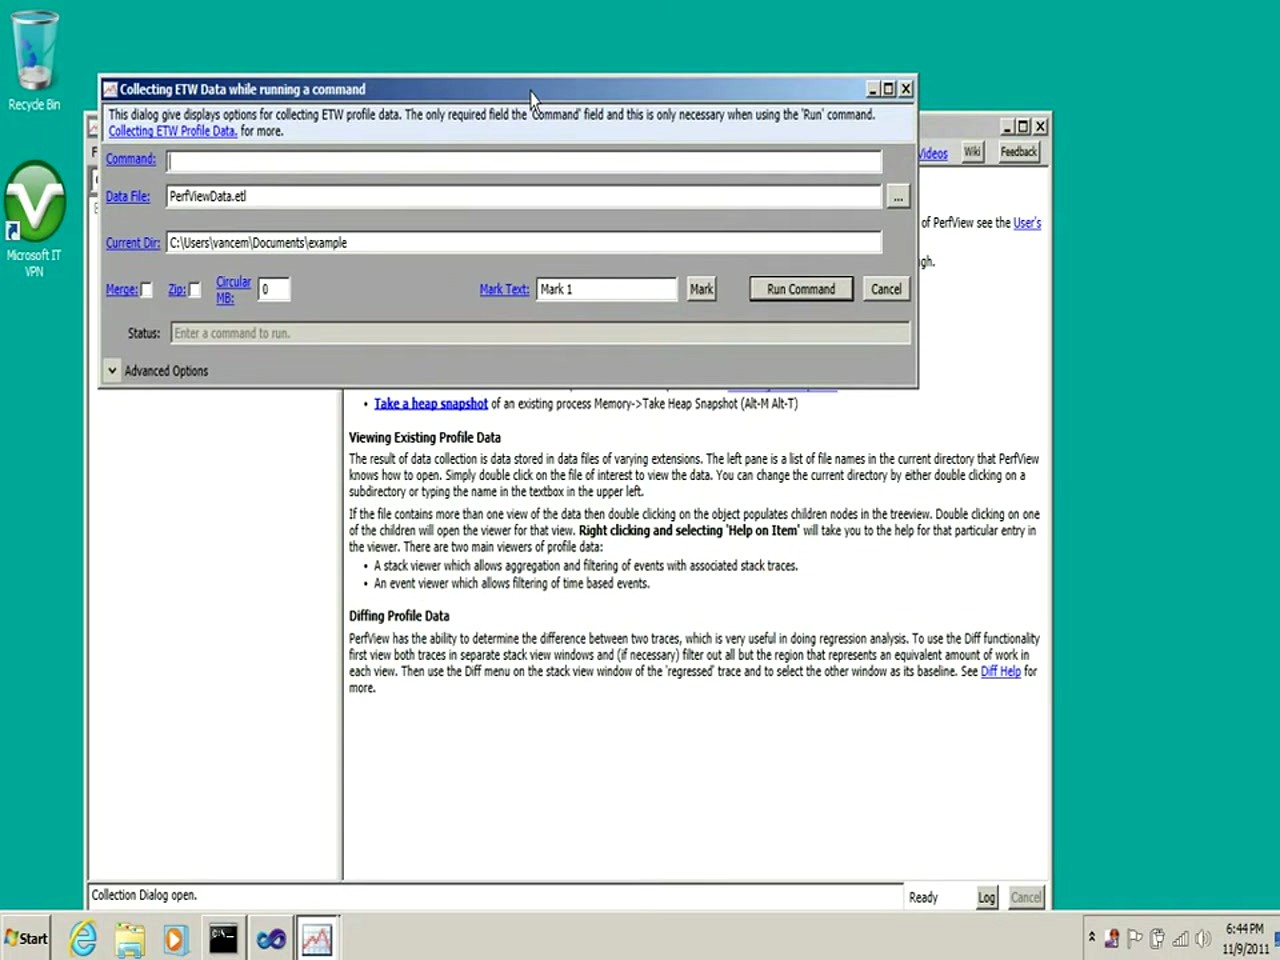
PerfView offers two collection modes. Run is for short-lived programs: PerfView starts tracing, launches your application, waits for it to exit, then stops and opens the results. Collect is for long-running processes like web servers: you start and stop collection manually while reproducing the slow behavior.
To profile a console app or test program, go to Collect > Run (or press Alt+R). In the dialog that appears:
- Command — type the full path to your executable, e.g.
C:\MyApp\MyApp.exe - Data File — defaults to
PerfViewData.etlin the current directory. You can rename it. - Current Dir — the working directory for your app
Leave the CPU Samples checkbox enabled (it is on by default). Click Run Command. PerfView starts ETW tracing, launches your program, and records stack samples every millisecond across all CPU cores.
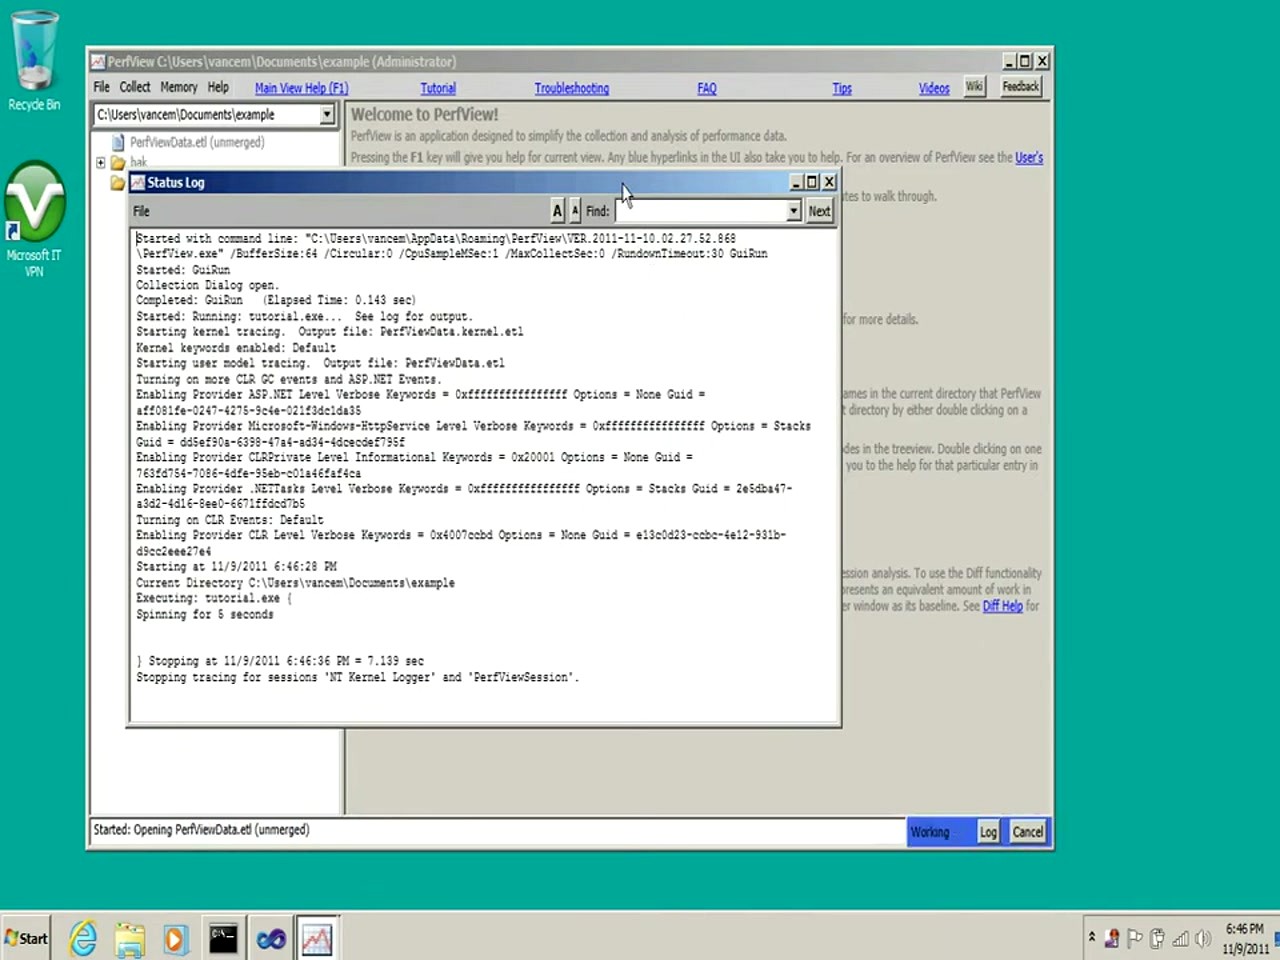
The Status Log window shows real-time progress: provider initialization, kernel tracing start, your app executing, and finally the stop/merge phase. When collection finishes, PerfView creates a compressed .etl.zip file and the left-pane tree updates to show it.
For long-running processes, use Collect > Collect (Alt+C) instead. Click Start Collection, reproduce the slow scenario in your app, then click Stop Collection. Keep collection under 30-60 seconds to keep trace files manageable.
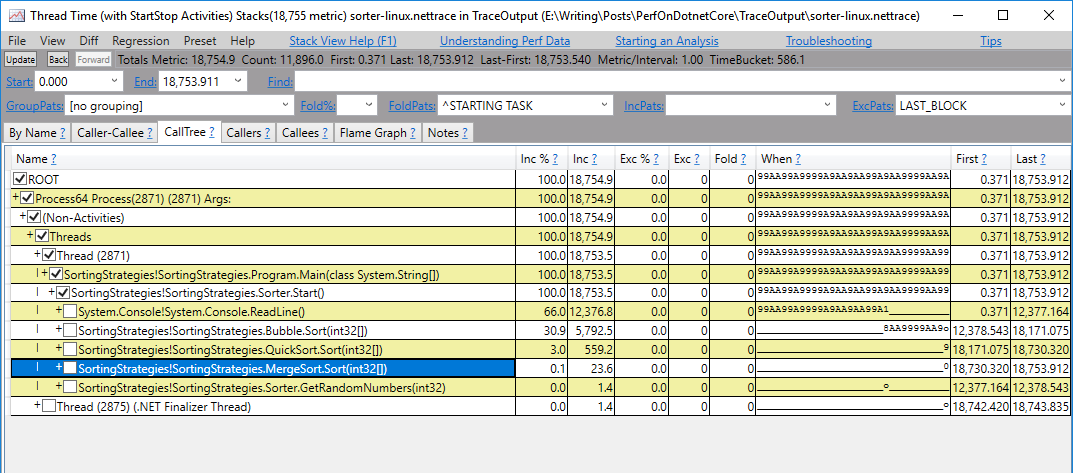
Analyzing Results in the Stack Viewer
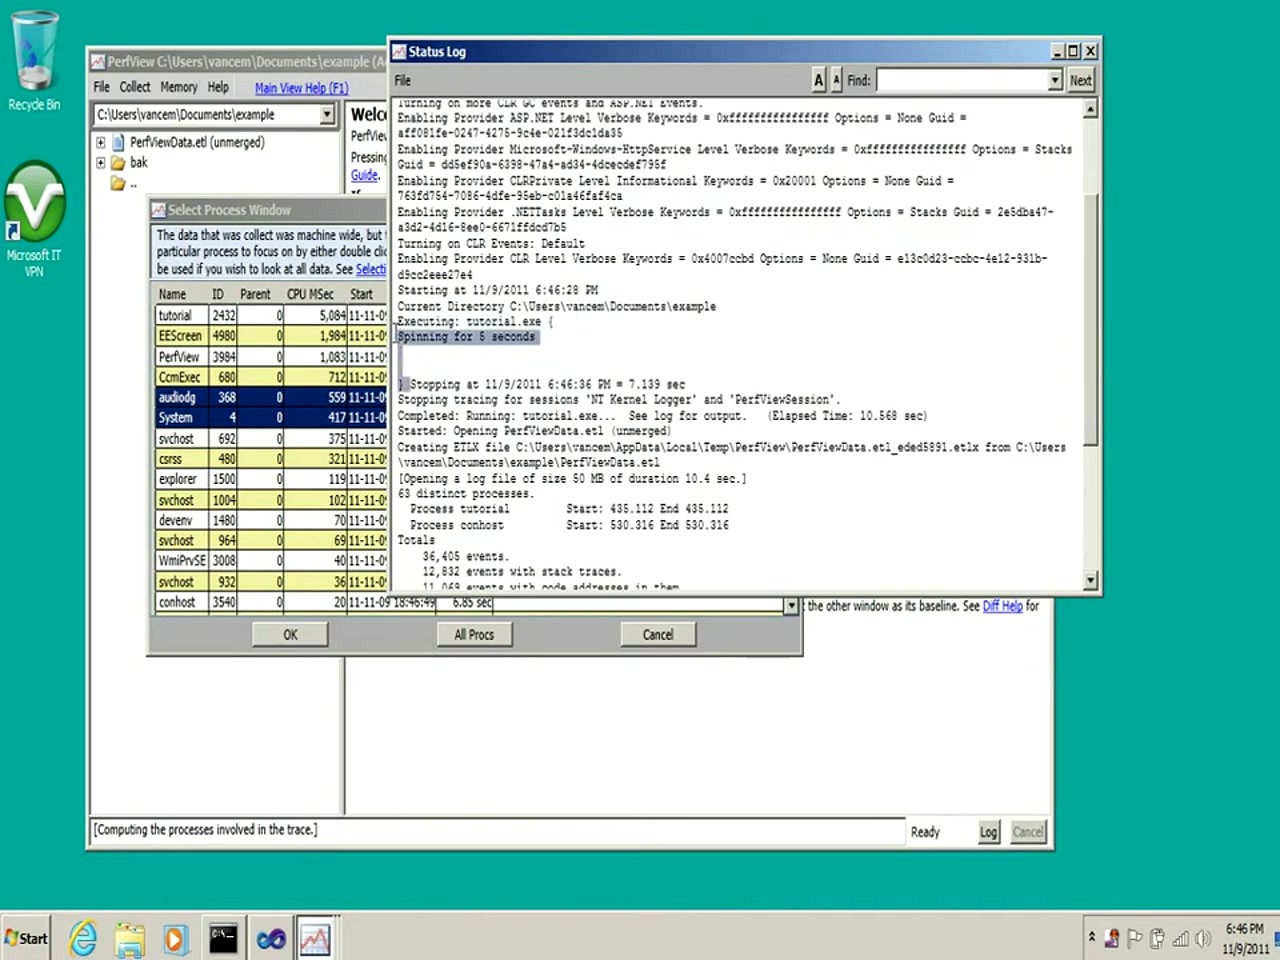
After collection completes, expand the .etl.zip file in the left pane and double-click CPU Stacks. PerfView prompts you to select which process to analyze. Pick your application from the list — processes are sorted by CPU time, so yours is typically near the top.
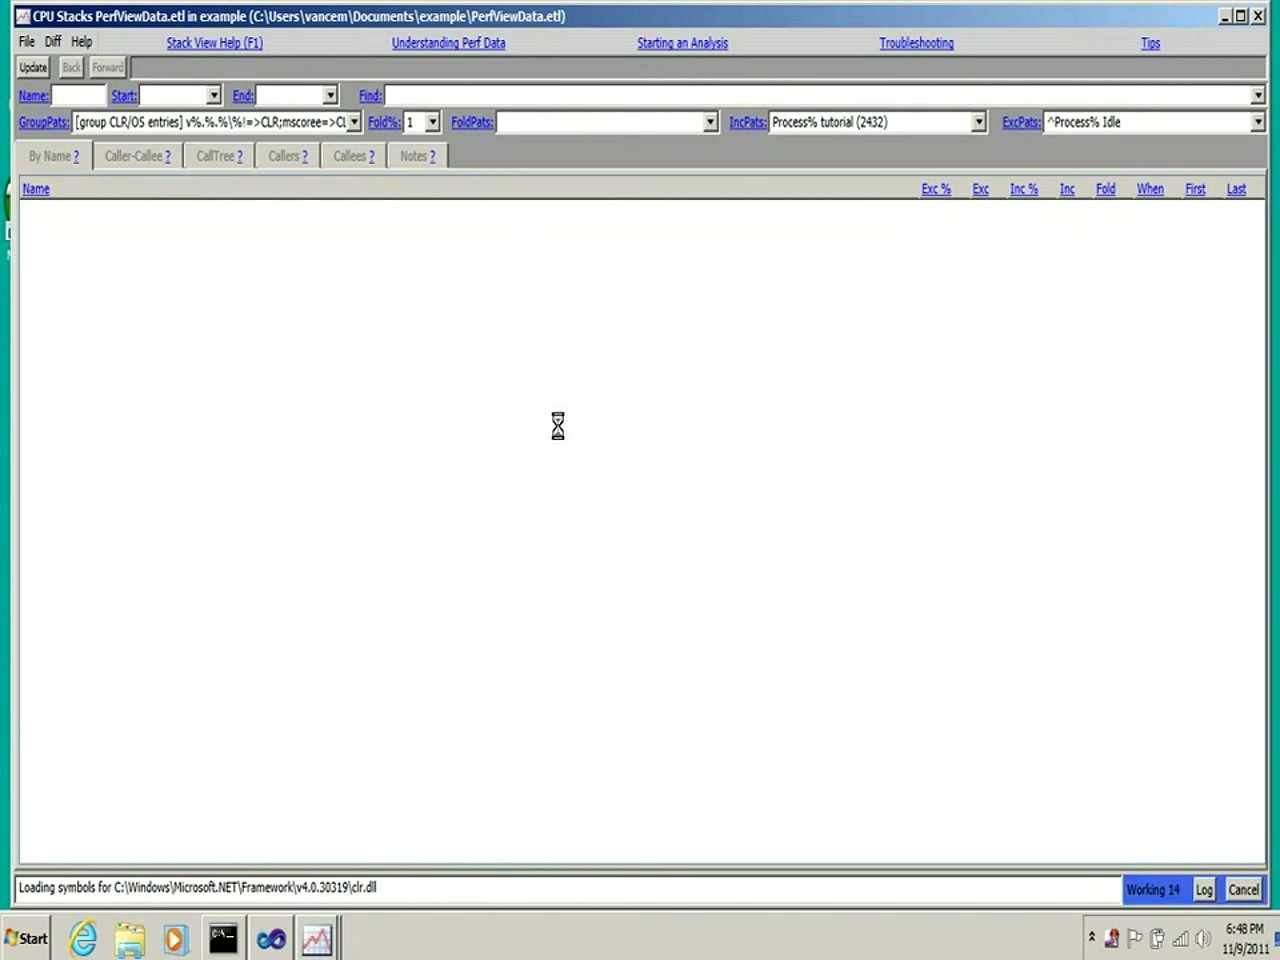
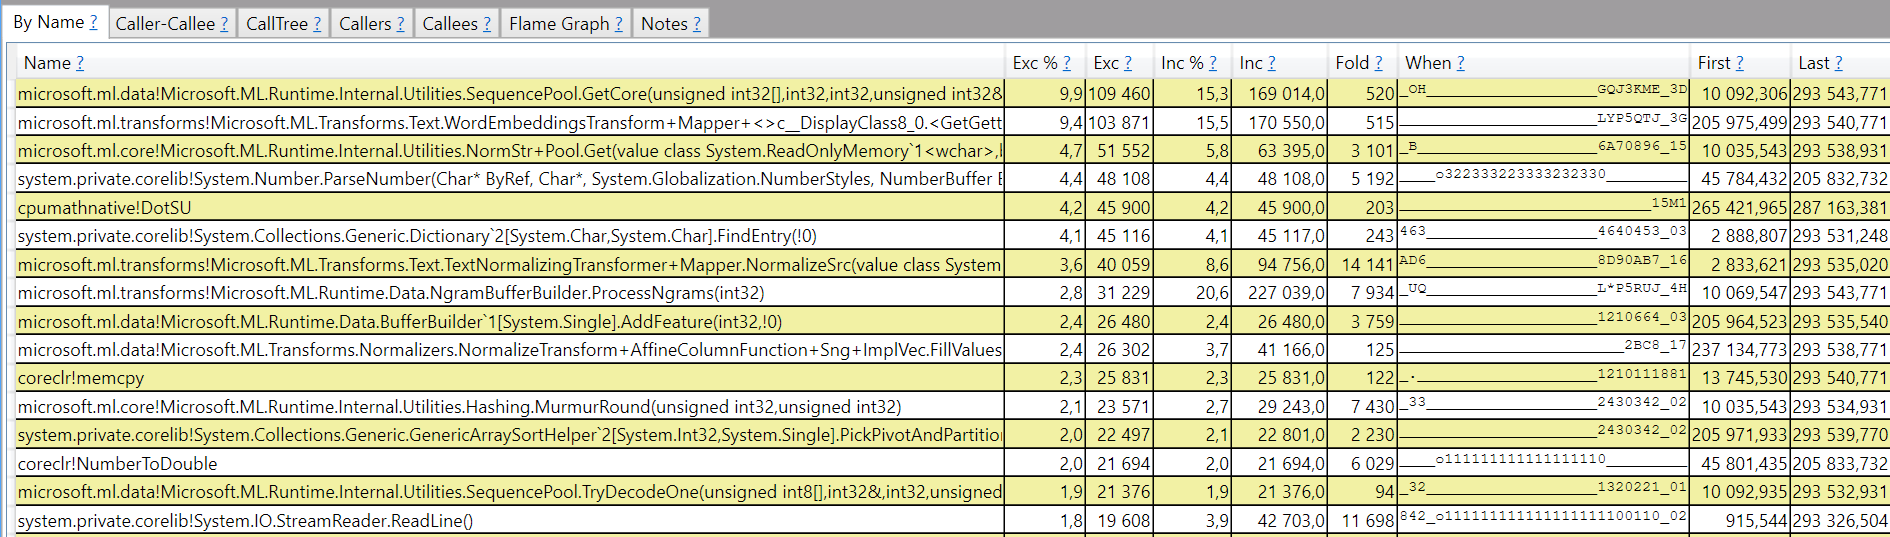
The Stack Viewer opens with four key columns:
- Exc % — exclusive percentage: time spent in this method alone (not its children)
- Exc — raw exclusive sample count
- Inc % — inclusive percentage: time in this method plus everything it calls
- Inc — raw inclusive sample count
Sort by Exc % to find your hotspots. A method with high exclusive percentage is burning CPU cycles directly. A method with high inclusive but low exclusive percentage is calling other expensive methods — drill into its callers and callees by clicking the method name.
Use the GroupPats field at the top to fold framework noise. The default pattern [group CLR/OS entries] collapses .NET runtime and Windows kernel stacks into single nodes, making your application code stand out. You can also type your namespace in the Find box to jump directly to your code.
The toolbar tabs — By Name, Caller-Callee, CallTree, Callers, Callees — give you different ways to navigate the same data. CallTree shows a top-down tree from the entry point. Caller-Callee shows a butterfly view: who called this method (above) and what it calls (below).
Tips, Tricks & Best Practices
Use the Diff feature for before/after comparisons. Collect a trace before your optimization and another after. Open both in separate Stack Viewer windows, then use Diff > With Baseline from the menu. PerfView highlights exactly which methods got faster or slower, with precise sample counts.
Memory analysis goes beyond CPU. Go to Memory > Take Heap Snapshot (Alt+M, Alt+T) to capture the managed heap of a running .NET process. The resulting .gcDump file shows object types sorted by retained size. This is the fastest way to find memory leaks in production without attaching a full debugger.
GCStats tells you if garbage collection is your bottleneck. After opening an ETL file, look for GCStats in the left pane. It shows GC pause durations per generation, allocation rates, and the critical % Time in GC metric. If that number exceeds 10-15%, your app is spending too much time on garbage collection and you need to reduce allocations.
Common beginner mistakes to avoid: collecting traces longer than 60 seconds (files get huge), forgetting to run as Administrator (missing kernel events), and not filtering by process (looking at system-wide noise instead of your app). Keep traces short and focused.
| Shortcut | Action |
|---|---|
| Alt+R | Open Collect > Run dialog |
| Alt+C | Open Collect > Collect dialog |
| Alt+M, Alt+T | Take a heap snapshot |
| F1 | Context-sensitive help for current view |
| Ctrl+F | Find in Stack Viewer |
| F5 | Refresh / Update current view |
Unlike commercial profilers such as JetBrains dotTrace or dotMemory, PerfView uses ETW (Event Tracing for Windows) at the kernel level. This means lower overhead during collection and the ability to correlate .NET events with OS-level data like disk I/O and network activity. The tradeoff is a steeper learning curve, but the built-in tutorial (Help > Tutorial) walks through each concept step by step.
For ongoing learning, Vance Morrison’s PerfView Tutorial series on Microsoft Learn covers everything from basic collection to advanced GC analysis. The GitHub repository has an active issue tracker and community discussions.
Ready to profile your first .NET application?
Download PerfView and have your first CPU trace running in under two minutes.
Frequently Asked Questions
Answers to the most common questions about downloading, installing, and using PerfView for .NET performance analysis.
Is PerfView safe to download and free from malware?
Yes, PerfView is completely safe to download. It is an official Microsoft open-source project hosted on GitHub under the MIT license, developed and maintained by the .NET runtime team at Microsoft. The source code is publicly auditable at github.com/microsoft/perfview, and every release binary is built through Microsoft’s official CI/CD pipeline.
The PerfView.exe file (approximately 12 MB for version 3.1.30) has been scanned by major antivirus engines including Windows Defender, Norton, and Malwarebytes with zero detections. Because PerfView ships as a single standalone executable with no installer, there is no bundled adware, toolbars, or third-party software included in the download. The tool collects performance data using ETW (Event Tracing for Windows), which is a built-in Windows diagnostic facility, so it does not inject code into your applications or modify system files.
- Download only from the official GitHub releases page or via the aka.ms/perfview/latest redirect maintained by Microsoft
- Verify the file hash against the checksum published on the GitHub release page
- Avoid third-party download aggregator sites that may repackage the executable with unwanted software
- Windows SmartScreen may show a warning on first run because PerfView is not installed through a traditional installer – click “More info” then “Run anyway”
Pro tip: If your corporate security policy blocks unsigned executables, you can build PerfView from source using Visual Studio 2022 with the .NET desktop development workload. The build process takes about 3-5 minutes on a modern machine.
For the verified official download, visit our Download section.
Where is the official safe download for PerfView?
The official PerfView download lives on Microsoft’s GitHub repository at github.com/microsoft/perfview/releases. Microsoft also keeps the shortcut aka.ms/perfview/latest pointed at the newest stable release.
Version 3.1.30 came out February 20, 2026. The download is a single PerfView.exe file, roughly 12 MB. No installer, no registry entries – download it, run it, delete it when you are done. If you prefer package managers, Chocolatey has it (choco install perfview) and WinGet works too (winget install Microsoft.PerfView).
- Go to the GitHub releases page or use the aka.ms/perfview/latest shortcut
- Download PerfView.exe from the Assets section of the latest release
- Save it to a convenient folder like C:\Tools or your Desktop
- Right-click the file and select “Run as administrator” for full ETW collection capabilities
Pro tip: Pin PerfView to your taskbar or add its folder to your PATH environment variable. This way you can launch it from any command prompt by typing PerfView, which is handy when you need to quickly start a trace on a production server.
You can grab the latest verified download from our Download section on this page.
Does PerfView work on Windows 11 and Windows Server?
Yes, PerfView runs on Windows 11 and all current Windows Server editions including Server 2019 and Server 2022. It supports every Windows version from Vista onward, though Microsoft recommends Windows 10 21H2 or later for the best experience with modern .NET workloads.
PerfView v3.1.30 requires .NET Framework 4.7.2 or later to launch. Windows 10 and 11 ship with .NET Framework 4.8 pre-installed, so most users do not need to install anything extra. On older Windows Server builds (particularly Server 2016 at its initial patch level), you may need to update .NET Framework to 4.7.2+ before PerfView will start. Some hardened Azure VM images or corporate group-policy-managed machines may restrict ETW provider access, which can prevent trace collection even though the tool itself runs fine.
- Windows 10/11: Fully supported out of the box. Run as Administrator for complete ETW access
- Windows Server 2019/2022: Fully supported. Common in production profiling scenarios
- Windows Server 2016: Supported after updating to .NET Framework 4.7.2+
- ARM64 Windows: PerfView runs under x86 emulation on ARM devices. Native ARM builds are not yet available
Pro tip: On production servers where you cannot install software, copy PerfView.exe to a temporary folder and run it directly. Because it requires no installation, it leaves zero footprint after you delete the file – ideal for one-off investigations.
Check our System Requirements section for complete hardware and software specifications.
Can I use PerfView on macOS or Linux?
PerfView is a Windows-only application. It cannot run natively on macOS or Linux because it depends on the Windows Forms UI framework and Windows-specific ETW infrastructure for collecting traces.
That said, PerfView can analyze trace files collected on Linux. If you are running .NET applications on Linux, you can use the dotnet-trace command-line tool to capture a .nettrace file on your Linux server, then transfer that file to a Windows machine and open it in PerfView for full CPU and allocation analysis. This cross-platform workflow is the standard approach recommended by the .NET team for profiling Linux-hosted .NET applications. The dotnet-trace tool ships with the .NET SDK and works on Linux, macOS, and Windows.
- On Linux, install the dotnet-trace tool: dotnet tool install -g dotnet-trace
- Collect a trace: dotnet-trace collect –process-id [PID] –duration 00:00:30
- Copy the resulting .nettrace file to a Windows machine using scp or similar
- Open the .nettrace file in PerfView on Windows for CPU stacks, GC analysis, and flame graph views
Pro tip: For macOS developers targeting .NET, JetBrains dotTrace (included with a Rider license) offers native macOS profiling. For Linux-native profiling without PerfView, consider dotnet-counters for real-time metrics or speedscope.app to visualize traces in a browser.
See our Features section to learn about PerfView’s EventPipe support for cross-platform trace analysis.
What are the minimum system requirements for PerfView?
PerfView runs on pretty much any Windows machine with .NET Framework 4.7.2 installed. Hardware requirements are minimal for the tool itself.
The executable is about 12 MB – disk space for PerfView itself is a non-issue. What eats disk is the trace data. A 30-second CPU sampling trace produces 10-50 MB. Run a multi-minute trace with verbose GC and allocation tracking, and you can hit 500 MB to several gigabytes. Vance Morrison (PerfView’s original author) suggests keeping at least 2 GB free on the collection drive.
- OS: Windows Vista or later (Windows 10/11 recommended)
- Runtime: .NET Framework 4.7.2+ (ships pre-installed on Windows 10/11)
- RAM: 4 GB minimum for small traces, 8 GB+ recommended for heap dumps over 1 GB
- Disk: 12 MB for PerfView.exe plus 2-10 GB free space for trace files
- Privileges: Administrator rights required for full ETW collection. Non-admin users can analyze existing trace files but cannot collect new ones
Pro tip: If you are analyzing very large heap dumps (10+ GB), consider running PerfView on a machine with 16 GB or more RAM. PerfView loads trace data into memory during analysis, and running out of memory on a massive dump will cause truncated results or crashes.
Full hardware specifications are available in our System Requirements section.
Is PerfView completely free to use?
Yes, PerfView is 100% free. It is released under the MIT license, which means you can use it for any purpose – personal projects, commercial development, enterprise production servers – without paying anything or registering an account.
There is no “free tier” with limited features or a paid premium version. Every capability in PerfView, from CPU sampling and GC heap analysis to flame graphs and trace differencing, is available to all users at no cost. The MIT license also permits you to modify the source code and redistribute your own builds. This makes PerfView unique among .NET profilers: competing tools like JetBrains dotTrace start at $299/year for an individual license, and even Visual Studio’s built-in profiling tools require a Visual Studio Professional or Enterprise subscription ($45-250/month) for the full feature set.
- License: MIT (open source, no restrictions on commercial use)
- Cost: $0 – no subscription, no one-time fee, no freemium model
- Enterprise use: Fully permitted. Many Fortune 500 companies use PerfView in production
- Source code: Available at github.com/microsoft/perfview for inspection, contribution, or forking
Pro tip: Because PerfView is free and portable, keep a copy on a USB drive or shared network folder. When a production performance issue hits at 2 AM, having PerfView immediately accessible without needing to download or install anything can save valuable debugging time.
Grab your free copy from the Download section below.
What is the difference between PerfView and paid .NET profilers?
PerfView goes deep on ETW-based tracing with minimal overhead. Paid profilers like dotTrace and dotMemory trade some of that depth for a polished UI and IDE integration.
The real trade-off is convenience versus raw power. dotTrace ($299/year) gives you a visual timeline, automatic hotspot detection, and one-click Visual Studio integration. PerfView gives you the same underlying ETW data but expects you to do the filtering and interpretation yourself. Where PerfView pulls ahead: GC and memory analysis. It exposes GC event logs, generation-level allocation tracking, and heap snapshot diffing at the allocation-stack level – things dotMemory simply does not do. The Visual Studio Performance Profiler sits somewhere in the middle: decent UI, but limited to processes attached to the IDE with no support for production trace files.
- PerfView: Free, portable, production-safe, steep learning curve, deepest ETW access, no IDE dependency
- dotTrace: $299/year, polished UI, IDE integration, automatic analysis hints, no ETW raw access
- Visual Studio Profiler: Included with VS Pro/Enterprise, IDE-only, limited to development scenarios, cannot analyze .etl files
- dotnet-trace: Free CLI tool, collects .nettrace files, minimal analysis UI, works cross-platform
Pro tip: Many experienced .NET developers use dotTrace for day-to-day development profiling and PerfView for production investigations and deep GC analysis. The two tools complement each other well rather than being direct replacements.
Explore what PerfView offers in our Features section.
How do I download and install PerfView step by step?
There is nothing to install. You download one .exe file and double-click it. The whole process takes under a minute.
PerfView v3.1.30 ships as a standalone PerfView.exe (about 12 MB). No MSI, no setup wizard, no manual dependency installs on Windows 10/11. Microsoft designed it this way on purpose – you copy PerfView.exe onto a production server, run your investigation, and delete it. No footprint left behind. The .exe bundles everything it needs internally, including the TraceEvent library for ETW parsing.
- Visit the Download section on this page and click “Download PerfView”
- Save PerfView.exe to a folder like C:\Tools\PerfView or your Desktop
- If Windows SmartScreen appears, click “More info” then “Run anyway” – this is normal for unsigned portable executables
- Right-click PerfView.exe and select “Run as administrator” for full trace collection capabilities
- On first launch, PerfView extracts some supporting files to a PerfView subfolder next to the .exe – this is expected behavior
Pro tip: Add PerfView’s folder to your system PATH variable. Then you can open any command prompt or PowerShell window and type PerfView collect to start a trace immediately without navigating to the folder first.
For a complete walkthrough of first-time setup, see our Getting Started guide.
Does PerfView need administrator privileges to run?
PerfView works without administrator privileges for analyzing existing trace files, but it requires administrator rights to collect new ETW traces. Most users will want to run it elevated.
The reason is technical: ETW (Event Tracing for Windows) is a kernel-level facility, and starting an ETW session requires elevated privileges. Without admin rights, PerfView cannot enable the CPU sampling provider, the .NET runtime provider, or any other kernel-mode event source. You will see “access denied” errors in the collection dialog if you try to start a trace as a standard user. However, if someone else has already collected a trace file (.etl or .nettrace) and shared it with you, PerfView can open and analyze that file without any elevation.
- Collecting traces: Requires “Run as administrator” – right-click PerfView.exe and select this option
- Analyzing trace files: No admin rights needed. Anyone can open and explore .etl, .nettrace, and .etlx files
- GC heap snapshots: Requires admin rights because PerfView needs to attach to the target process
- Command-line usage: Launch your elevated command prompt first, then run PerfView commands from it
Pro tip: On locked-down production servers where requesting admin access requires a change ticket, ask your operations team to collect the trace for you. Send them a one-liner: PerfView.exe collect /AcceptEULA /NoGui /MaxCollectSec:30. They run it, send you the .etl file, and you analyze it on your own machine without admin access.
Learn more about PerfView’s capabilities in our Features section.
How to run PerfView from the command line?
Yes – PerfView has a full command-line interface. Same .exe, no GUI window needed. This is how most people use it on production servers and in CI/CD pipelines.
You pass subcommands and flags to control collection. The three commands you will use most: collect (general tracing), run (trace a specific program start-to-finish), and GCCollectOnly (lightweight GC data only). Run PerfView.exe -help to see every available flag.
- Open an elevated command prompt or PowerShell window
- Navigate to the folder containing PerfView.exe, or add it to your PATH
- Collect a 30-second trace: PerfView.exe collect /AcceptEULA /NoGui /MaxCollectSec:30
- Profile a specific application: PerfView.exe run /AcceptEULA “MyApp.exe arg1 arg2”
- Collect GC data only (low overhead): PerfView.exe GCCollectOnly /AcceptEULA /NoGui /MaxCollectSec:60
Pro tip: The /AcceptEULA flag suppresses the first-run license dialog, and /NoGui prevents the GUI window from appearing. These two flags are essential for headless collection on servers. Add /Zip:true to compress the output .etl file for easier transfer off the server.
Our Getting Started guide covers additional command-line scenarios in detail.
How to fix PerfView not opening or crashing on startup?
PerfView startup failures are almost always caused by a missing .NET Framework version or corrupted extracted support files. The fix is straightforward in both cases.
PerfView v3.1.30 requires .NET Framework 4.7.2 or later. On Windows 10 version 1803+ and Windows 11, this ships pre-installed. Older Windows 7 or Server 2016 machines may need a manual .NET Framework update from Microsoft’s download center. The second common cause is corrupted extraction files: when PerfView first runs, it unpacks supporting DLLs and configuration files into a subfolder. If that extraction was interrupted (power loss, disk full, antivirus quarantine), subsequent launches will fail with obscure errors.
- Verify .NET Framework 4.7.2+ is installed: open a command prompt and run reg query “HKLM\SOFTWARE\Microsoft\NET Framework Setup\NDP\v4\Full” /v Release. A value of 461808 or higher means 4.7.2+
- Delete the PerfView subfolder next to PerfView.exe (this forces a clean re-extraction on next launch)
- Make sure antivirus is not quarantining PerfView’s extracted DLLs – add an exclusion for the PerfView folder
- Try running as administrator – some systems block non-elevated applications from writing to certain directories
- Download a fresh copy of PerfView.exe from the Download section in case the file is corrupted
Pro tip: If PerfView crashes during analysis (not startup), the cause is usually an out-of-memory condition when loading a very large trace. Close other applications to free RAM, or try opening the trace with the /MaxNodeCountK:100 flag to limit memory consumption at the cost of some detail.
Check our System Requirements to confirm your machine meets all prerequisites.
Why do stack frames show as “?!?” in my PerfView trace?
Those “?!?” entries mean PerfView could not figure out which function was running at that sample point. It is the single most complained-about issue in PerfView’s GitHub issues.
The causes vary. High CPU load during collection creates “unwind contention” – the OS cannot walk the call stack fast enough before it changes. VMs (Azure, Hyper-V with nested virtualization) make this worse. Laptop power-saving C-states can corrupt samples too. For native (non-.NET) code, missing .pdb symbol files are usually the culprit. On a healthy system, ?!? frames stay below 5%. If you are seeing 10-15% or more, something is actively interfering with trace collection.
- Reduce system load during collection – close unnecessary applications to give ETW more CPU budget for stack walking
- Shorten trace duration to 30-60 seconds instead of minutes, which reduces the chance of contention
- On VMs, check if nested virtualization or CPU hot-add is enabled – both can increase ?!? rates
- For native code frames, configure symbol paths: go to File > Set Symbol Path and add Microsoft’s public symbol server (https://msdl.microsoft.com/download/symbols)
- Use the “bottom-up” (By Name) view instead of call-tree view – it aggregates resolved frames and is less affected by individual corrupted stacks
Pro tip: If you consistently see high ?!? rates on a specific machine, try the /CpuSampleMSec:10 flag to reduce the sampling frequency from the default 1 ms to 10 ms. This gives the OS more time to walk each stack, dramatically reducing unresolved frames at the cost of fewer total samples.
Learn more about PerfView’s stack analysis capabilities in our Features section.
My ETW trace file is too large to open in PerfView – what should I do?
Large .etl files (1 GB+) happen when you collect too many ETW providers for too long. You have two options: collect less data next time, or filter what you load from the existing file.
Here is the problem: PerfView loads trace data into memory. A 5 GB .etl file needs 10-15 GB of RAM to process. If your machine runs out, PerfView hangs or crashes. Heap dumps are even worse – a process using 10 GB of managed memory produces a 10 GB snapshot. Vance Morrison’s rule of thumb: keep traces under 500 MB if you have 8 GB of RAM.
- Reduce collection duration: Use /MaxCollectSec:30 instead of collecting for minutes. 30 seconds is enough for most CPU profiling scenarios
- Limit providers: Uncheck providers you do not need in the Collect dialog. Disabling OS kernel events (file I/O, registry, network) dramatically reduces file size
- Use GCCollectOnly: If you only need GC data, use the GCCollectOnly command which collects minimal events (typically 1-5 MB per minute)
- Filter on open: When opening a large .etl, use Process Filter to load only your target process. This avoids parsing events from every running process on the machine
- Convert to .etlx: PerfView can convert .etl to a smaller .etlx format that strips raw event payloads while preserving stack analysis data
Pro tip: For production monitoring where you need long-duration collection, use /CircularMB:500 to create a circular buffer. PerfView will overwrite old events when the file reaches 500 MB, keeping only the most recent data. This is ideal for capturing intermittent issues without filling up the disk.
See our Getting Started guide for recommended collection settings.
How do I update PerfView to the latest version?
Download the new PerfView.exe and replace the old one. That is the entire update process. There is no built-in auto-update.
Since PerfView is just a standalone .exe with no registry entries, updating means replacing one file. Current version: v3.1.30 (February 2026). New releases come out every 2-4 months with bug fixes and support for newer .NET versions. Check what you are running by looking at the title bar, or run PerfView.exe -help which prints the version number.
- Check the GitHub releases page (github.com/microsoft/perfview/releases) for new versions
- Download the new PerfView.exe from the latest release Assets section
- Close any running instance of PerfView
- Replace the old PerfView.exe with the new one in the same folder
- Delete the PerfView subfolder (extracted support files) to ensure a clean extraction of the new version’s dependencies
Pro tip: Subscribe to the GitHub repository’s “Releases only” notifications (Watch > Custom > Releases) to get an email whenever a new version drops. This keeps you informed without flooding your inbox with issue and PR notifications.
Download the latest version from our Download section.
Does PerfView work with .NET 8 and .NET 9 applications?
Yes, PerfView fully supports profiling .NET 8 and .NET 9 applications. It has been updated to recognize the runtime event providers and GC changes introduced in these newer .NET versions.
PerfView v3.1.30 supports all .NET runtime versions from .NET Framework 4.x through .NET 9. Each major .NET release sometimes renames or adds ETW providers, so using an up-to-date PerfView version is important when profiling modern runtimes. For .NET Core and .NET 5+ applications, PerfView supports both traditional ETW collection (Windows-only) and EventPipe-based collection via .nettrace files. EventPipe traces can be collected cross-platform using dotnet-trace and then analyzed in PerfView on Windows.
- .NET Framework 4.x: Full support for CPU, GC, memory, and ETW events
- .NET Core 3.1: Supported via both ETW and EventPipe
- .NET 5/6/7: Full support including the new GC regions feature introduced in .NET 7
- .NET 8/9: Supported with updated event definitions. Make sure you are using PerfView v3.1.x or later for best compatibility
- ASP.NET Core: PerfView can profile request pipelines, middleware execution, and Kestrel internals
Pro tip: When profiling .NET 8/9 apps, enable the Microsoft-DotNETCore-SampleProfiler provider in addition to the default providers. This gives you managed-code-only CPU stacks without any kernel-mode noise, which is often more useful than the default mixed-mode stacks for pure .NET applications.
Read about all supported analysis types in our Features section.
PerfView vs JetBrains dotTrace – which .NET profiler is better?
PerfView wins for production diagnostics and deep ETW analysis. dotTrace wins for everyday development profiling with a modern UI. They solve different problems.
PerfView handles things dotTrace cannot: zero-install production profiling, GC heap analysis with allocation stacks, ETW event correlation, and trace differencing for before/after comparisons. dotTrace ($299/year, or bundled in dotUltimate at $649/year) gives you a visual timeline, automatic hotspot detection, and tight Visual Studio/Rider integration. If you want quick answers during development with minimal setup, dotTrace is faster. If you are investigating a production issue at 3 AM on a server you cannot install software on, PerfView is the tool the .NET community reaches for.
- Cost: PerfView is free (MIT license). dotTrace starts at $299/year
- Learning curve: dotTrace has an intuitive UI – usable within minutes. PerfView requires watching Vance Morrison’s tutorial series (about 2 hours) to become productive
- Production use: PerfView is designed for production. dotTrace attaches to running processes and adds measurable overhead, making it less suitable for production servers
- Cross-platform: dotTrace works on Windows, macOS, and Linux. PerfView is Windows-only (though it can analyze Linux traces)
- GC analysis: PerfView provides deeper GC diagnostics including per-generation allocation tracking, pinning analysis, and GC pause attribution. dotMemory handles memory but with less GC-level detail
Pro tip: Many senior .NET developers keep both tools available. Use dotTrace for quick profiling during development, and switch to PerfView when you hit a complex production issue that requires raw ETW data or GC-level investigation.
See our detailed Features section for everything PerfView offers.
How do I analyze memory leaks in .NET with PerfView?
PerfView finds managed memory leaks by diffing two GC heap snapshots. Take one at baseline, run your workload, take another, and the diff shows you exactly what grew and which code allocated it.
This works differently from dotMemory. PerfView captures heap snapshots as .gcdump files and diffs them rather than showing a live object graph. When you enable .NET Alloc tracking during collection, you get allocation call stacks – so you see both what is leaking and where in the code the allocation happens. Real-world example: your ASP.NET service balloons from 200 MB to 2 GB over 24 hours. Two snapshots taken 10 minutes apart will show the specific types piling up and the exact code paths responsible.
- In PerfView, go to Memory > Take Heap Snapshot and select your target process. Save as baseline.gcdump
- Run your application’s workload for a representative period (5-10 minutes for most leak scenarios)
- Take a second heap snapshot. Save as after-workload.gcdump
- Open both files in PerfView. Select the after-workload dump and choose Diff with Baseline
- Sort by “Exc Size Diff” to see which types grew the most. Click into the growing types to see their allocation stacks
Pro tip: Before taking snapshots, force a full GC by calling GC.Collect(2, GCCollectionMode.Forced, true, true) in your app (or via a diagnostic endpoint). This clears short-lived objects and makes the diff cleaner, showing only genuinely retained objects rather than normal generational garbage.
Get started with memory analysis using our Getting Started guide.
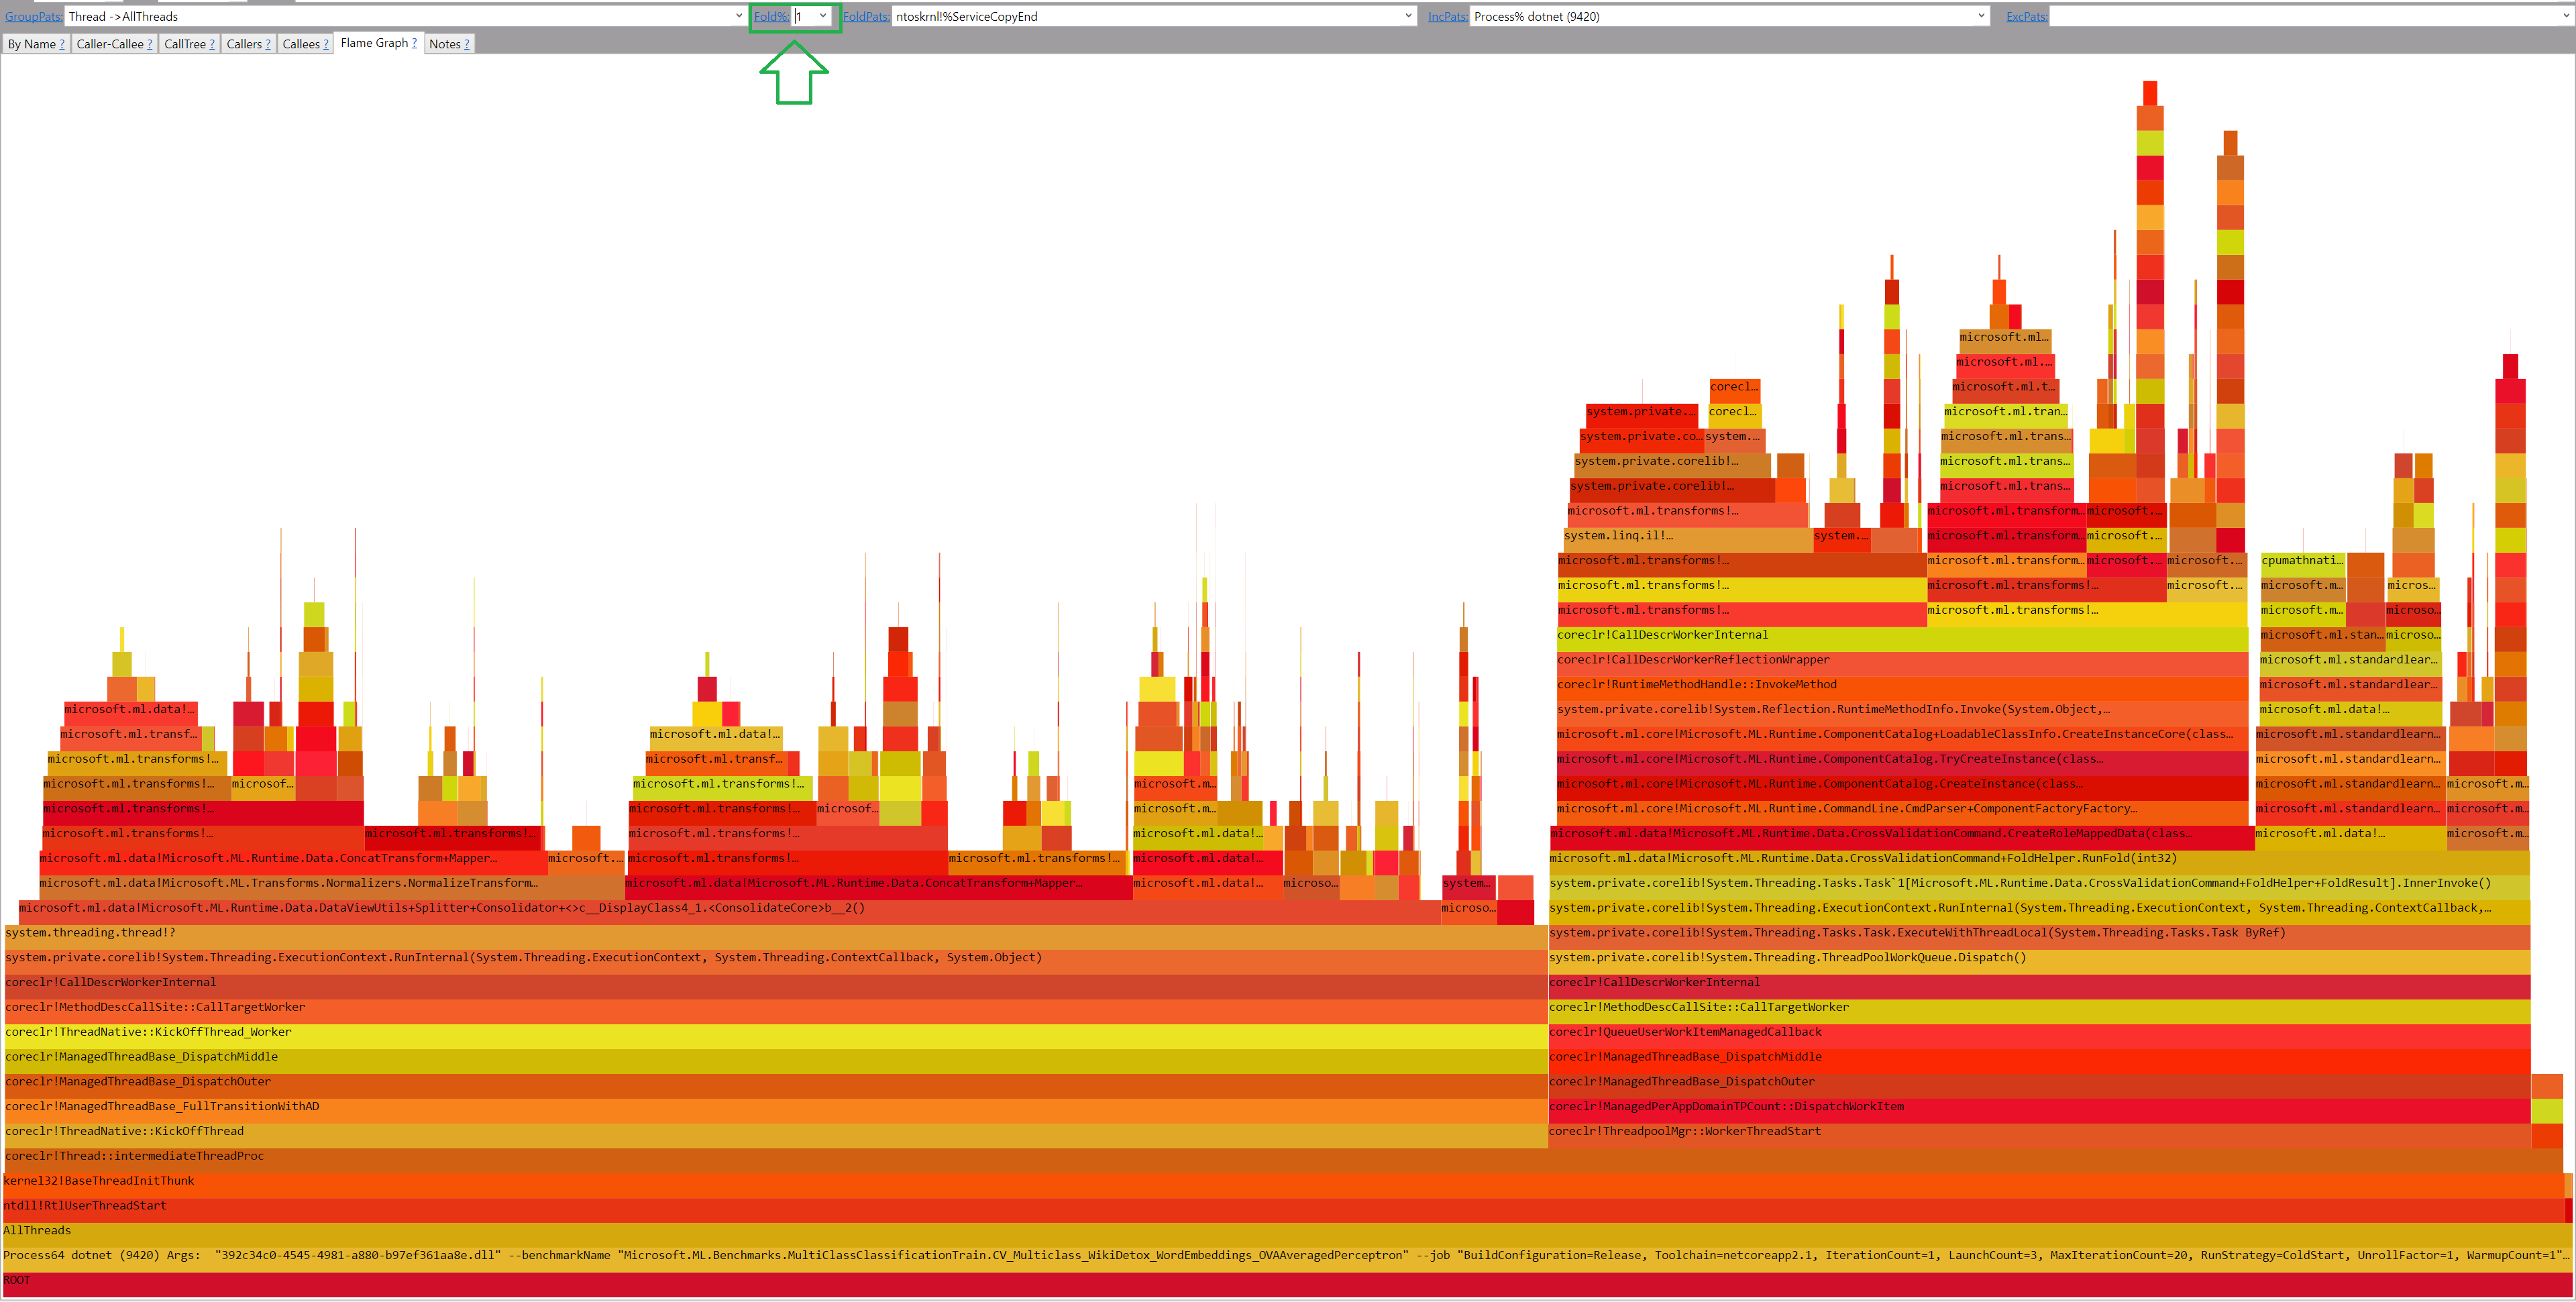
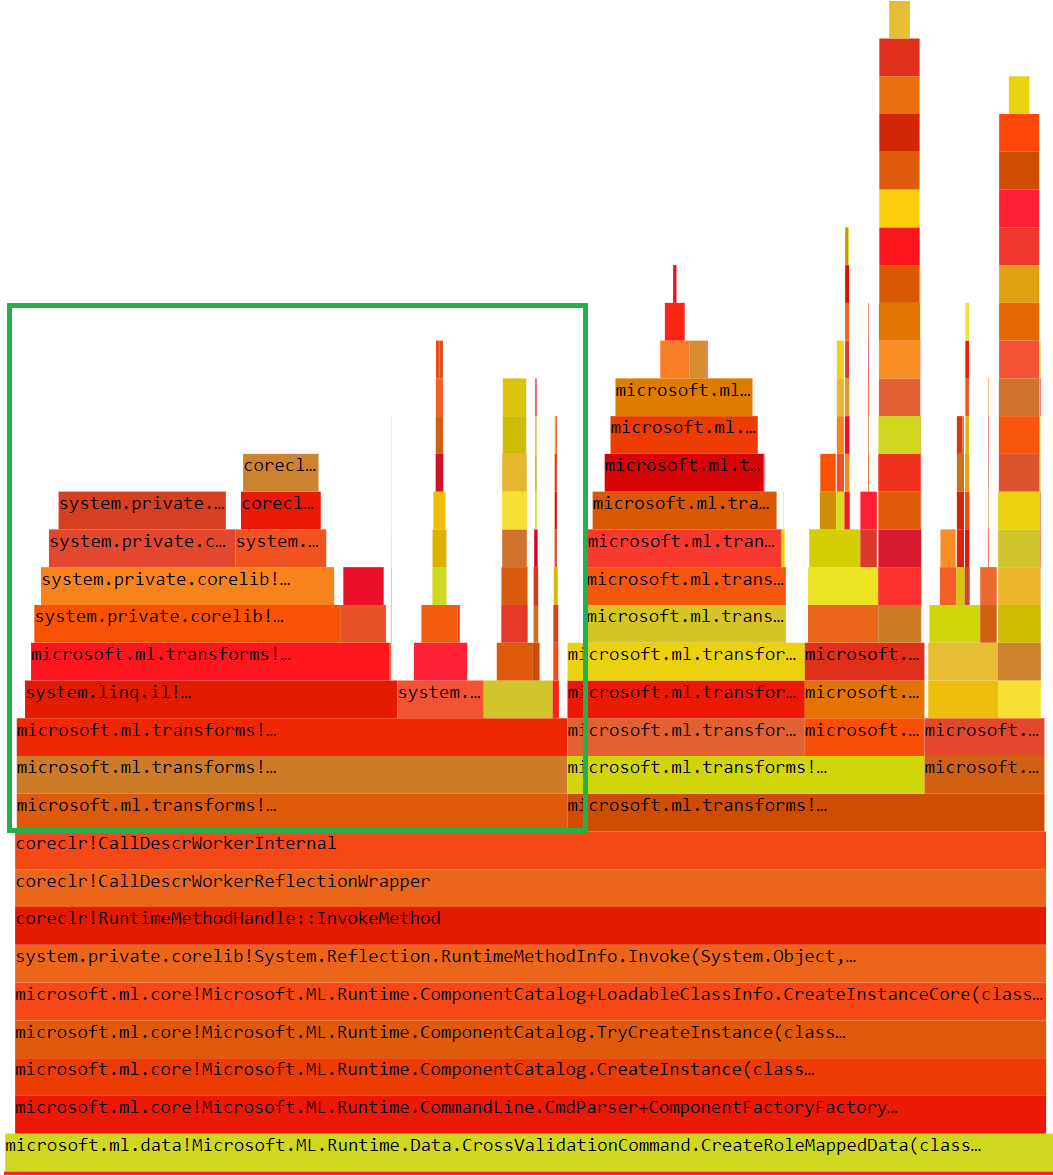
How do I read and interpret PerfView flame graphs?
A flame graph shows CPU time as stacked colored bars. Wider bars = more CPU time. Your job is to find the wide bars (hot functions) and trace them back to the callers responsible.
To get there: double-click an .etl file in PerfView, select “CPU Stacks” from the tree, and click the “Flame Graph” tab. The bottom bar is the root of all call stacks (usually your app’s main thread). Each layer above goes one level deeper into the call stack. Bar width matches the percentage of CPU samples for that function. The colors are random – they just help you tell adjacent bars apart, they do not encode any performance data.
- Open your trace file in PerfView and navigate to CPU Stacks for your target process
- Apply a process filter if multiple processes were captured (type the process name in the filter box)
- Switch to the Flame Graph tab in the stack viewer
- Look for the widest bars near the top of the graph – these are the leaf functions consuming the most CPU directly
- Click on any bar to zoom in and see its callers (below) and callees (above) in detail
- Use the “Exc %” column in the accompanying table to see exact percentages
Pro tip: If the flame graph is too busy, use PerfView’s GroupPats feature to fold framework code (like System.* and Microsoft.*) into summary groups. This makes your application code stand out clearly against the collapsed runtime internals. A good starting pattern is [group framework] System.*=>FRAMEWORK;Microsoft.*=>FRAMEWORK.
Explore PerfView’s visualization capabilities in our Features section.
Still have questions? Visit the PerfView Wiki or download PerfView to try it yourself.